
What this board answers
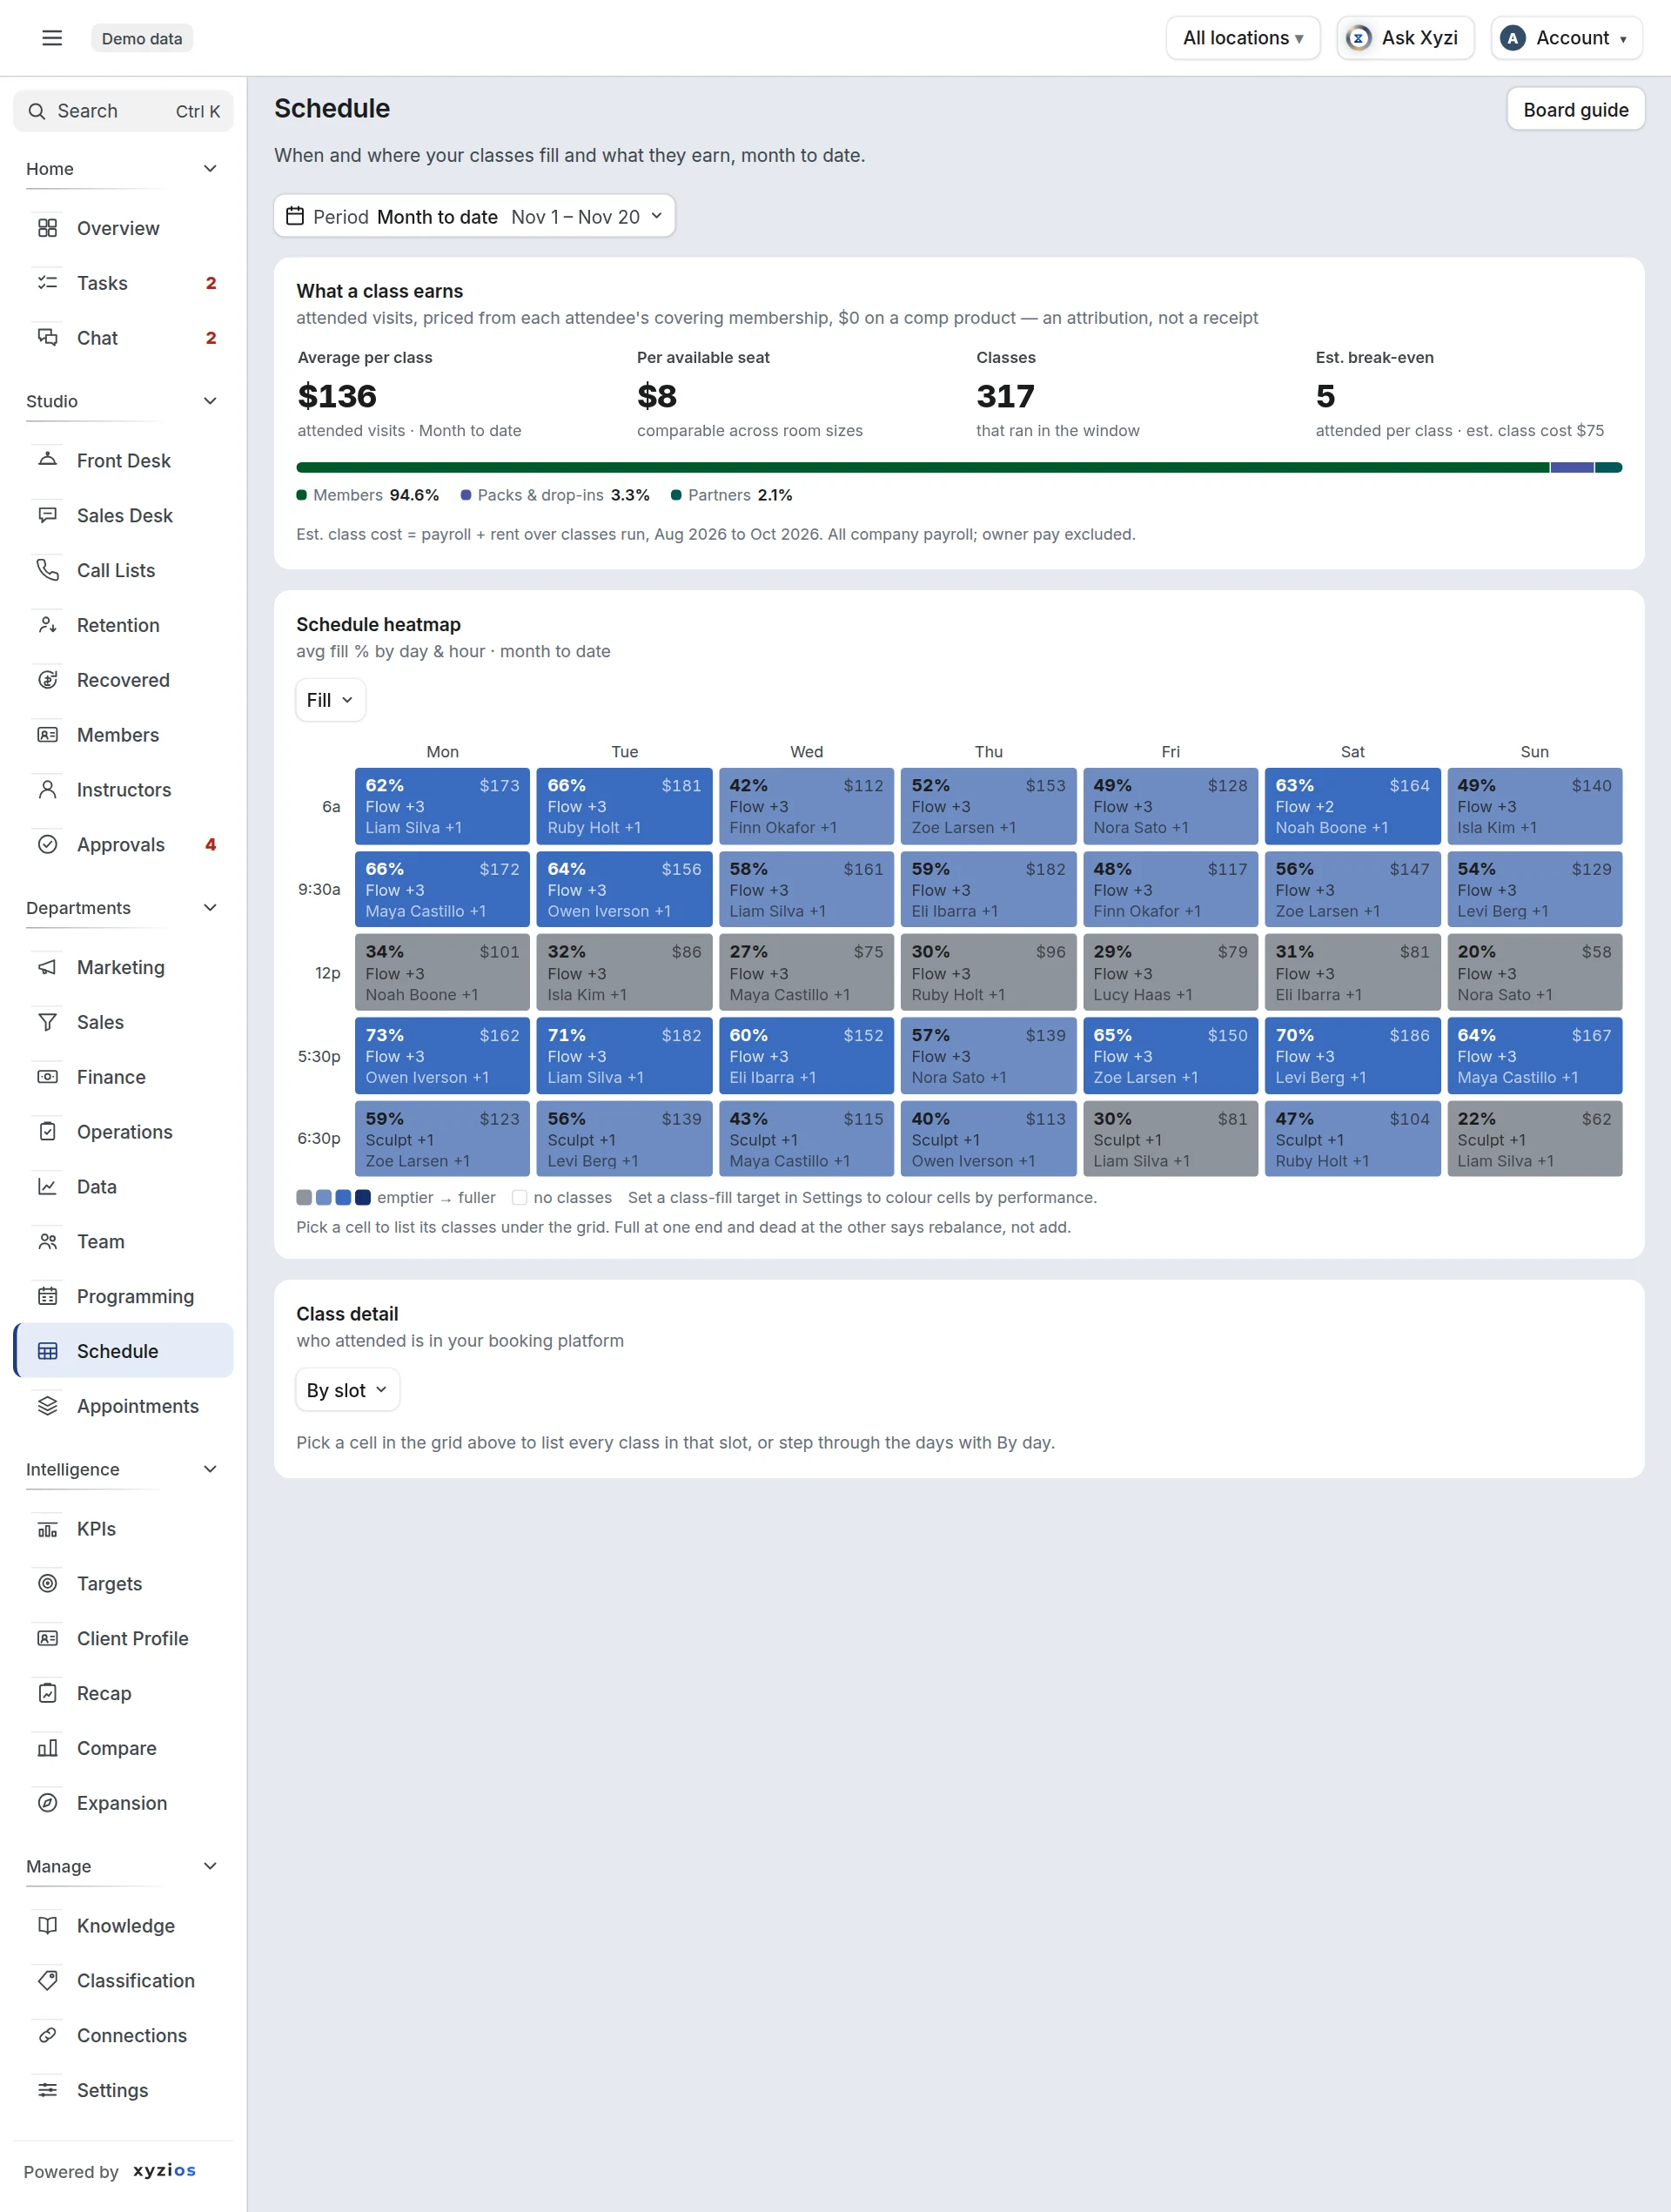
Which slots work and which do not? Schedule puts how full each day and hour runs beside what a class in it earns, so you can see a full class that earns little, or a half-empty one worth protecting, before you move or merge anything. Programming and Operations each keep a small summary of it with a button that opens this board.
How to read it
Period picks the window from the standard list, in three groups, each with its dates: To date (Week to date, Month to date, Quarter to date, Year to date), Previous, a whole period that ended (Previous week, Sunday to Saturday, Previous month, Previous quarter, Previous year), and Rolling, up to today (Last 30 days, Last 90 days, Last 6 months, Last 12 months). It opens on Month to date. A Previous window, or a long rolling one, is offered only when the schedule holds it whole. Everything on the board answers for the chosen window.
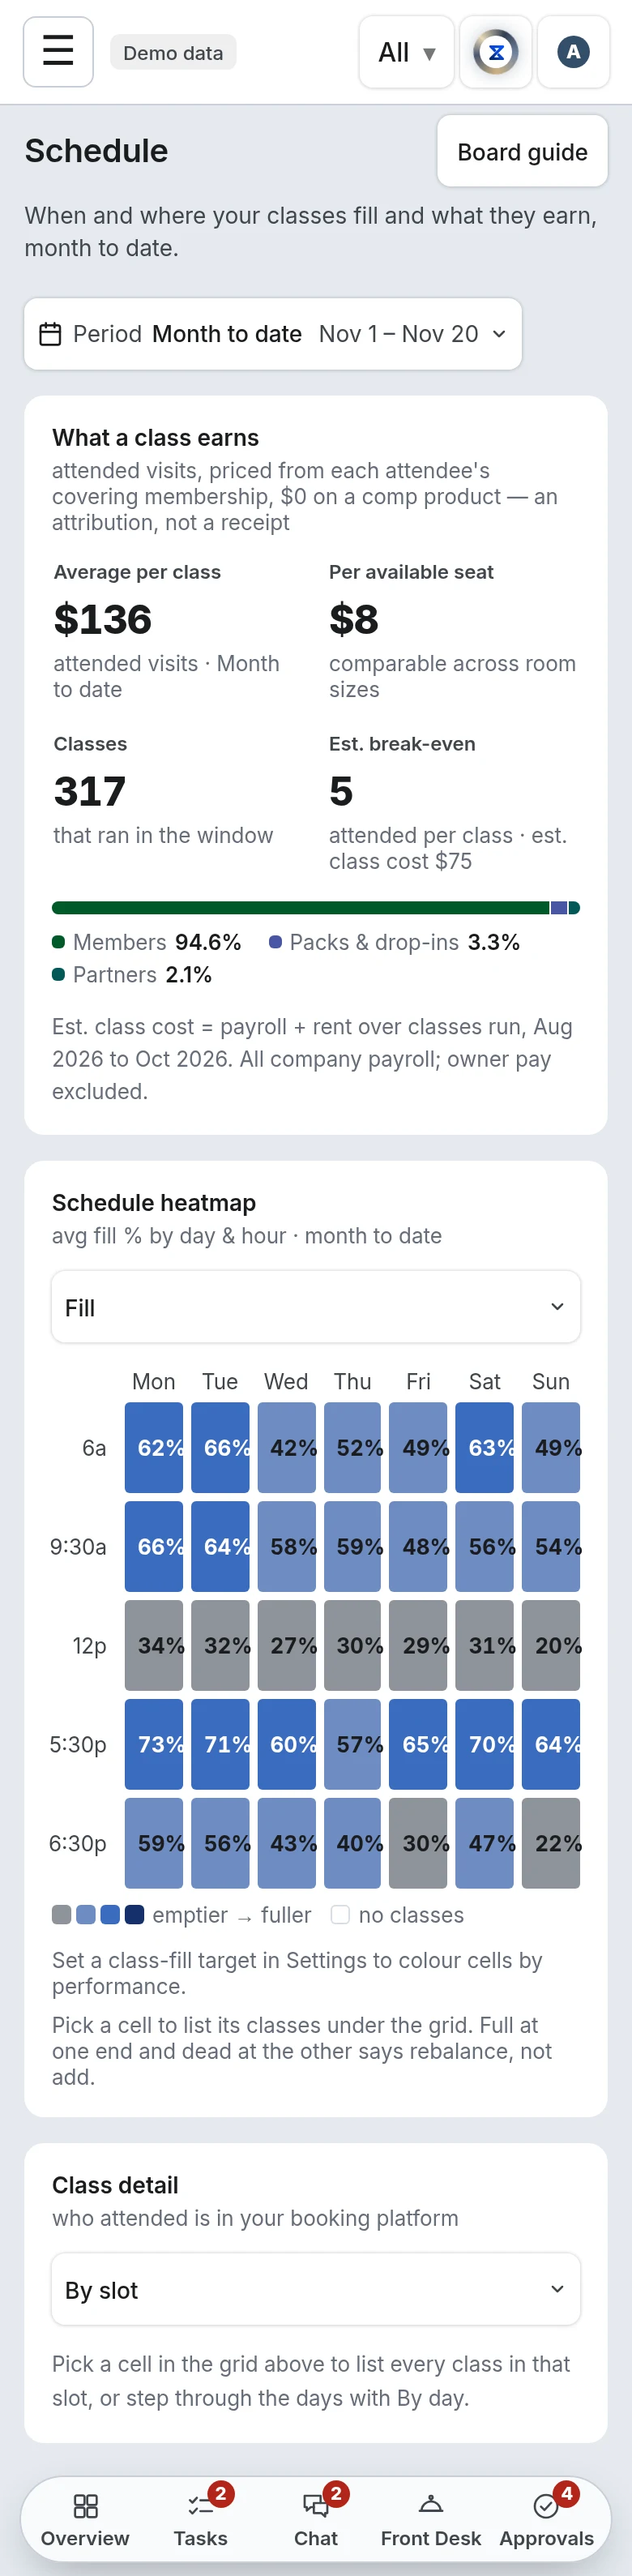
1What a class earns prices each attended visit from the attendee’s membership: Average per class, Per available seat (comparable across room sizes), Classes in the window and, where a partner’s rate is unknown, Visits not priced, left out rather than guessed. With the See location costs grant it adds Est. break-even, the attended heads per class that cover its estimated cost.
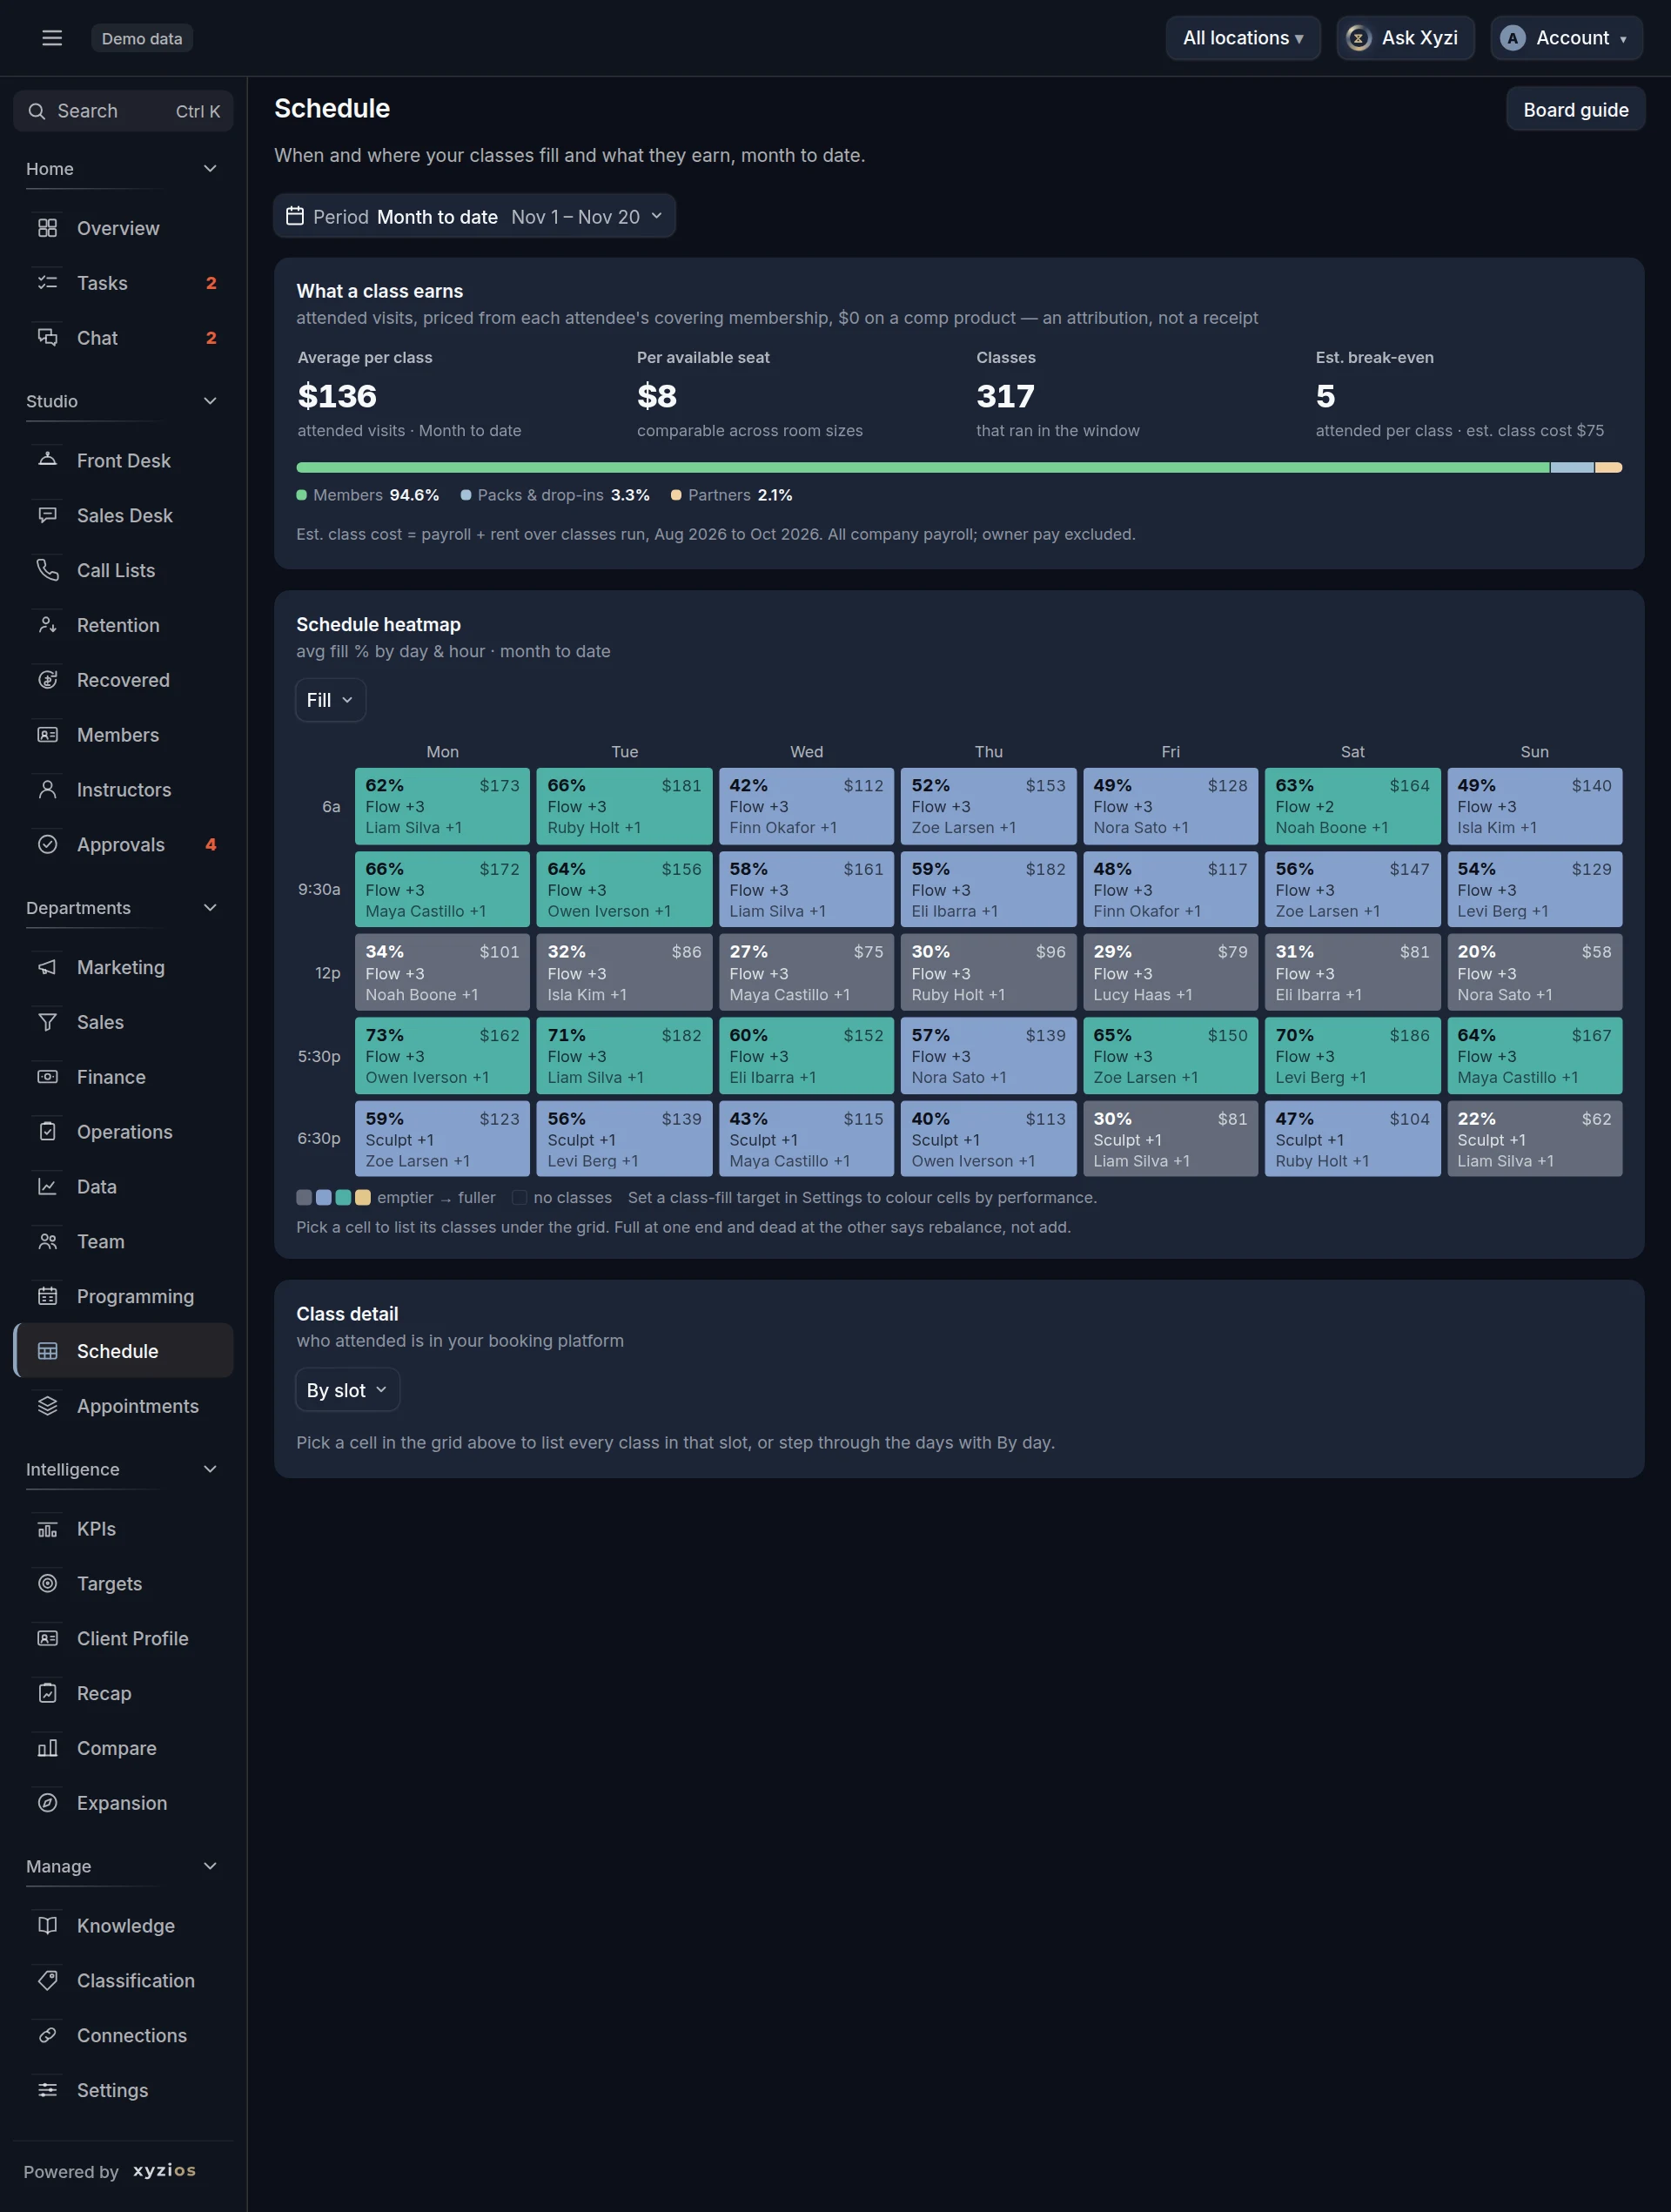
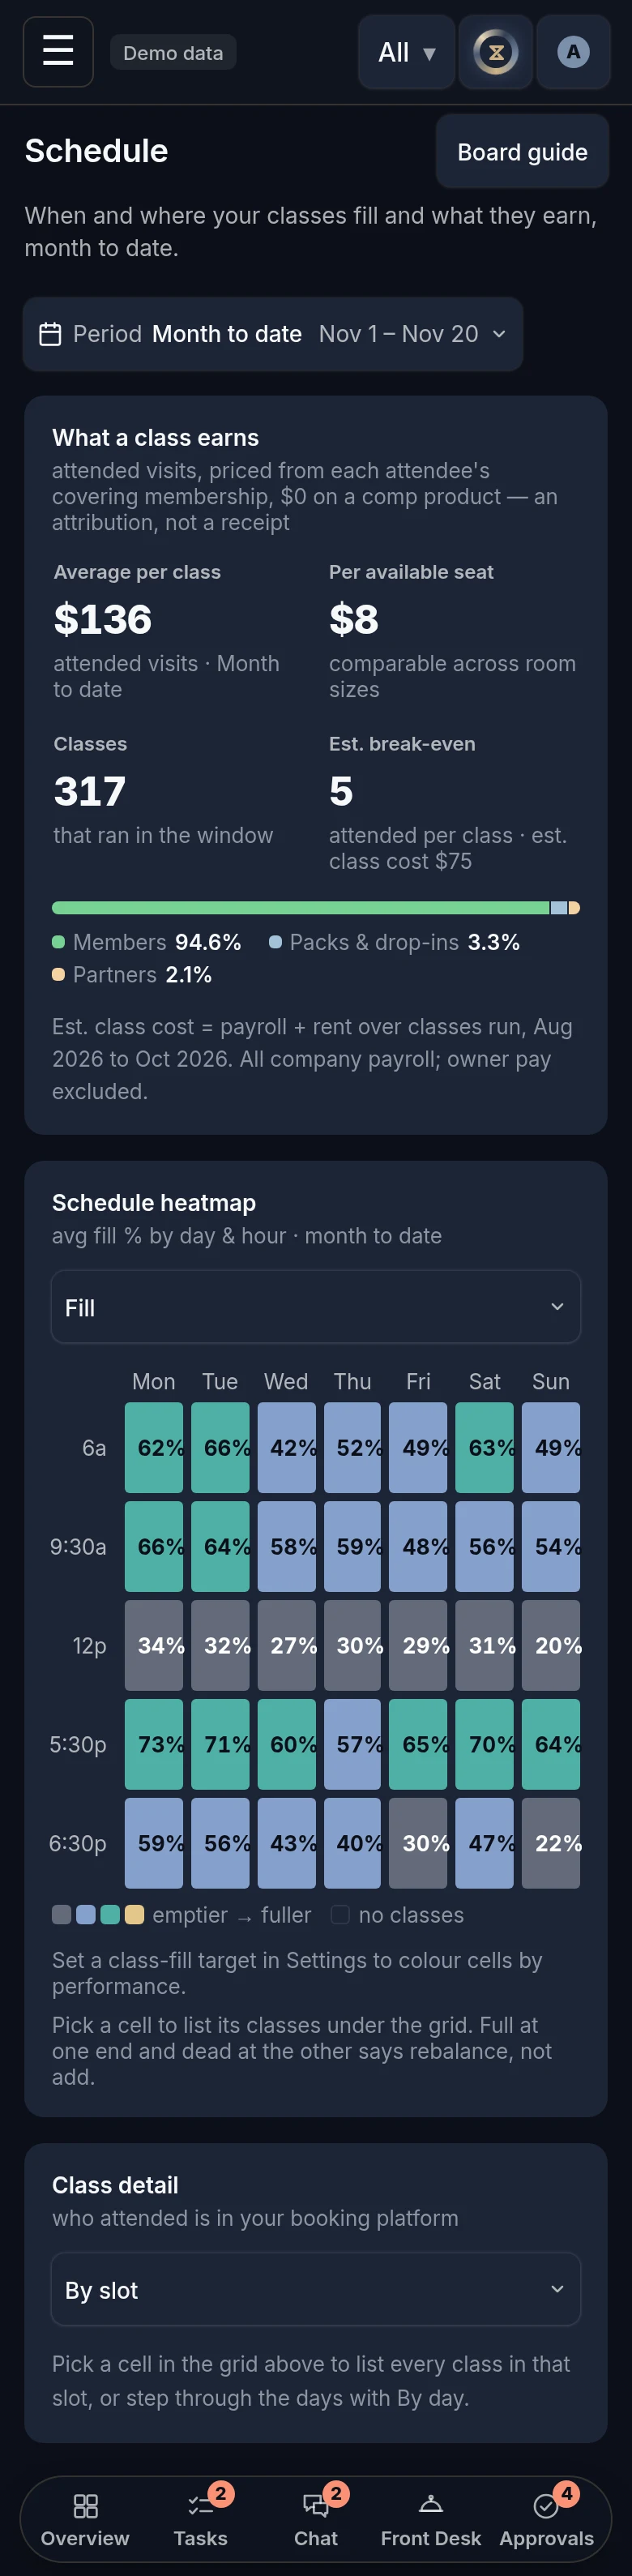
2Schedule heatmap is the grid of day by hour. The switch above it picks what each cell shows: Fill, Returning, Earnings, Per seat, Show rate or Waitlist, each cell naming its class and the instructor who teaches it most. Fill is average fill, coloured well above target, on target, below target or below the alert floor, the last one ringed so colour is never the only sign. Earnings is dollars per class against the window’s own average, with the fill in the corner, so a full slot that earns little stands out. Returning is the share of a slot’s clients who came to that slot on two or more days in the window, against the window’s own average, with the fill in the corner, so a slot that fills with one-timers stands out. It is offered on windows of four weeks or more: in a week everyone comes to a weekly slot once. Partner visits are left out. Show rate is who came out of who was still booked when the class began: the people who came and the no-shows, never the late cancels, who told you. Pointing at a cell lists each class in it; picking it opens the slot in Class detail.
3Class detail lists the classes behind the grid. Pick a cell and it shows every class in that slot over the window, newest first; switch to By day and step through the days, where a class the studio cancelled shows greyed and counts in nothing. All classes lists every class in the window, newest day first, to narrow by instructor, format, location or a flag. Each class is one line: its time, the class, where and who taught it (a sub is marked), booked against capacity with its fill, who came, and what it earned. Tap a class for its no-shows, late cancels, waitlist and break-even. Who attended is in your booking platform.
Pick a location and the board reads for that site alone. If you manage one location you see only that site.
What to do here
- Set a class-fill target and alert floor in Settings, so the Fill view can grade itself.
- Read Fill for the dead hours, then switch to Earnings for the same slots. Move or merge before you add.
- Look for slots that are full on Fill and pale on Earnings: somebody else is paying for that class.
- ✦ Ask Xyzi in the top bar explains any number.
Common questions
I see Fill but no Earnings.
What a class earns comes from Operations, so it shows for anyone who can open Operations.
The heatmap’s legend says “emptier → fuller”.
No fill target is set. Set one in Settings and the grid grades itself into well above target, on target, below target and below the alert floor.
Where did the heatmap on Programming go?
It moved here. Programming keeps Schedule at a glance, a small version with the fullest and emptiest slot, and Operations keeps What a class earns with its best and worst slot. Both open this board.