
What this board answers
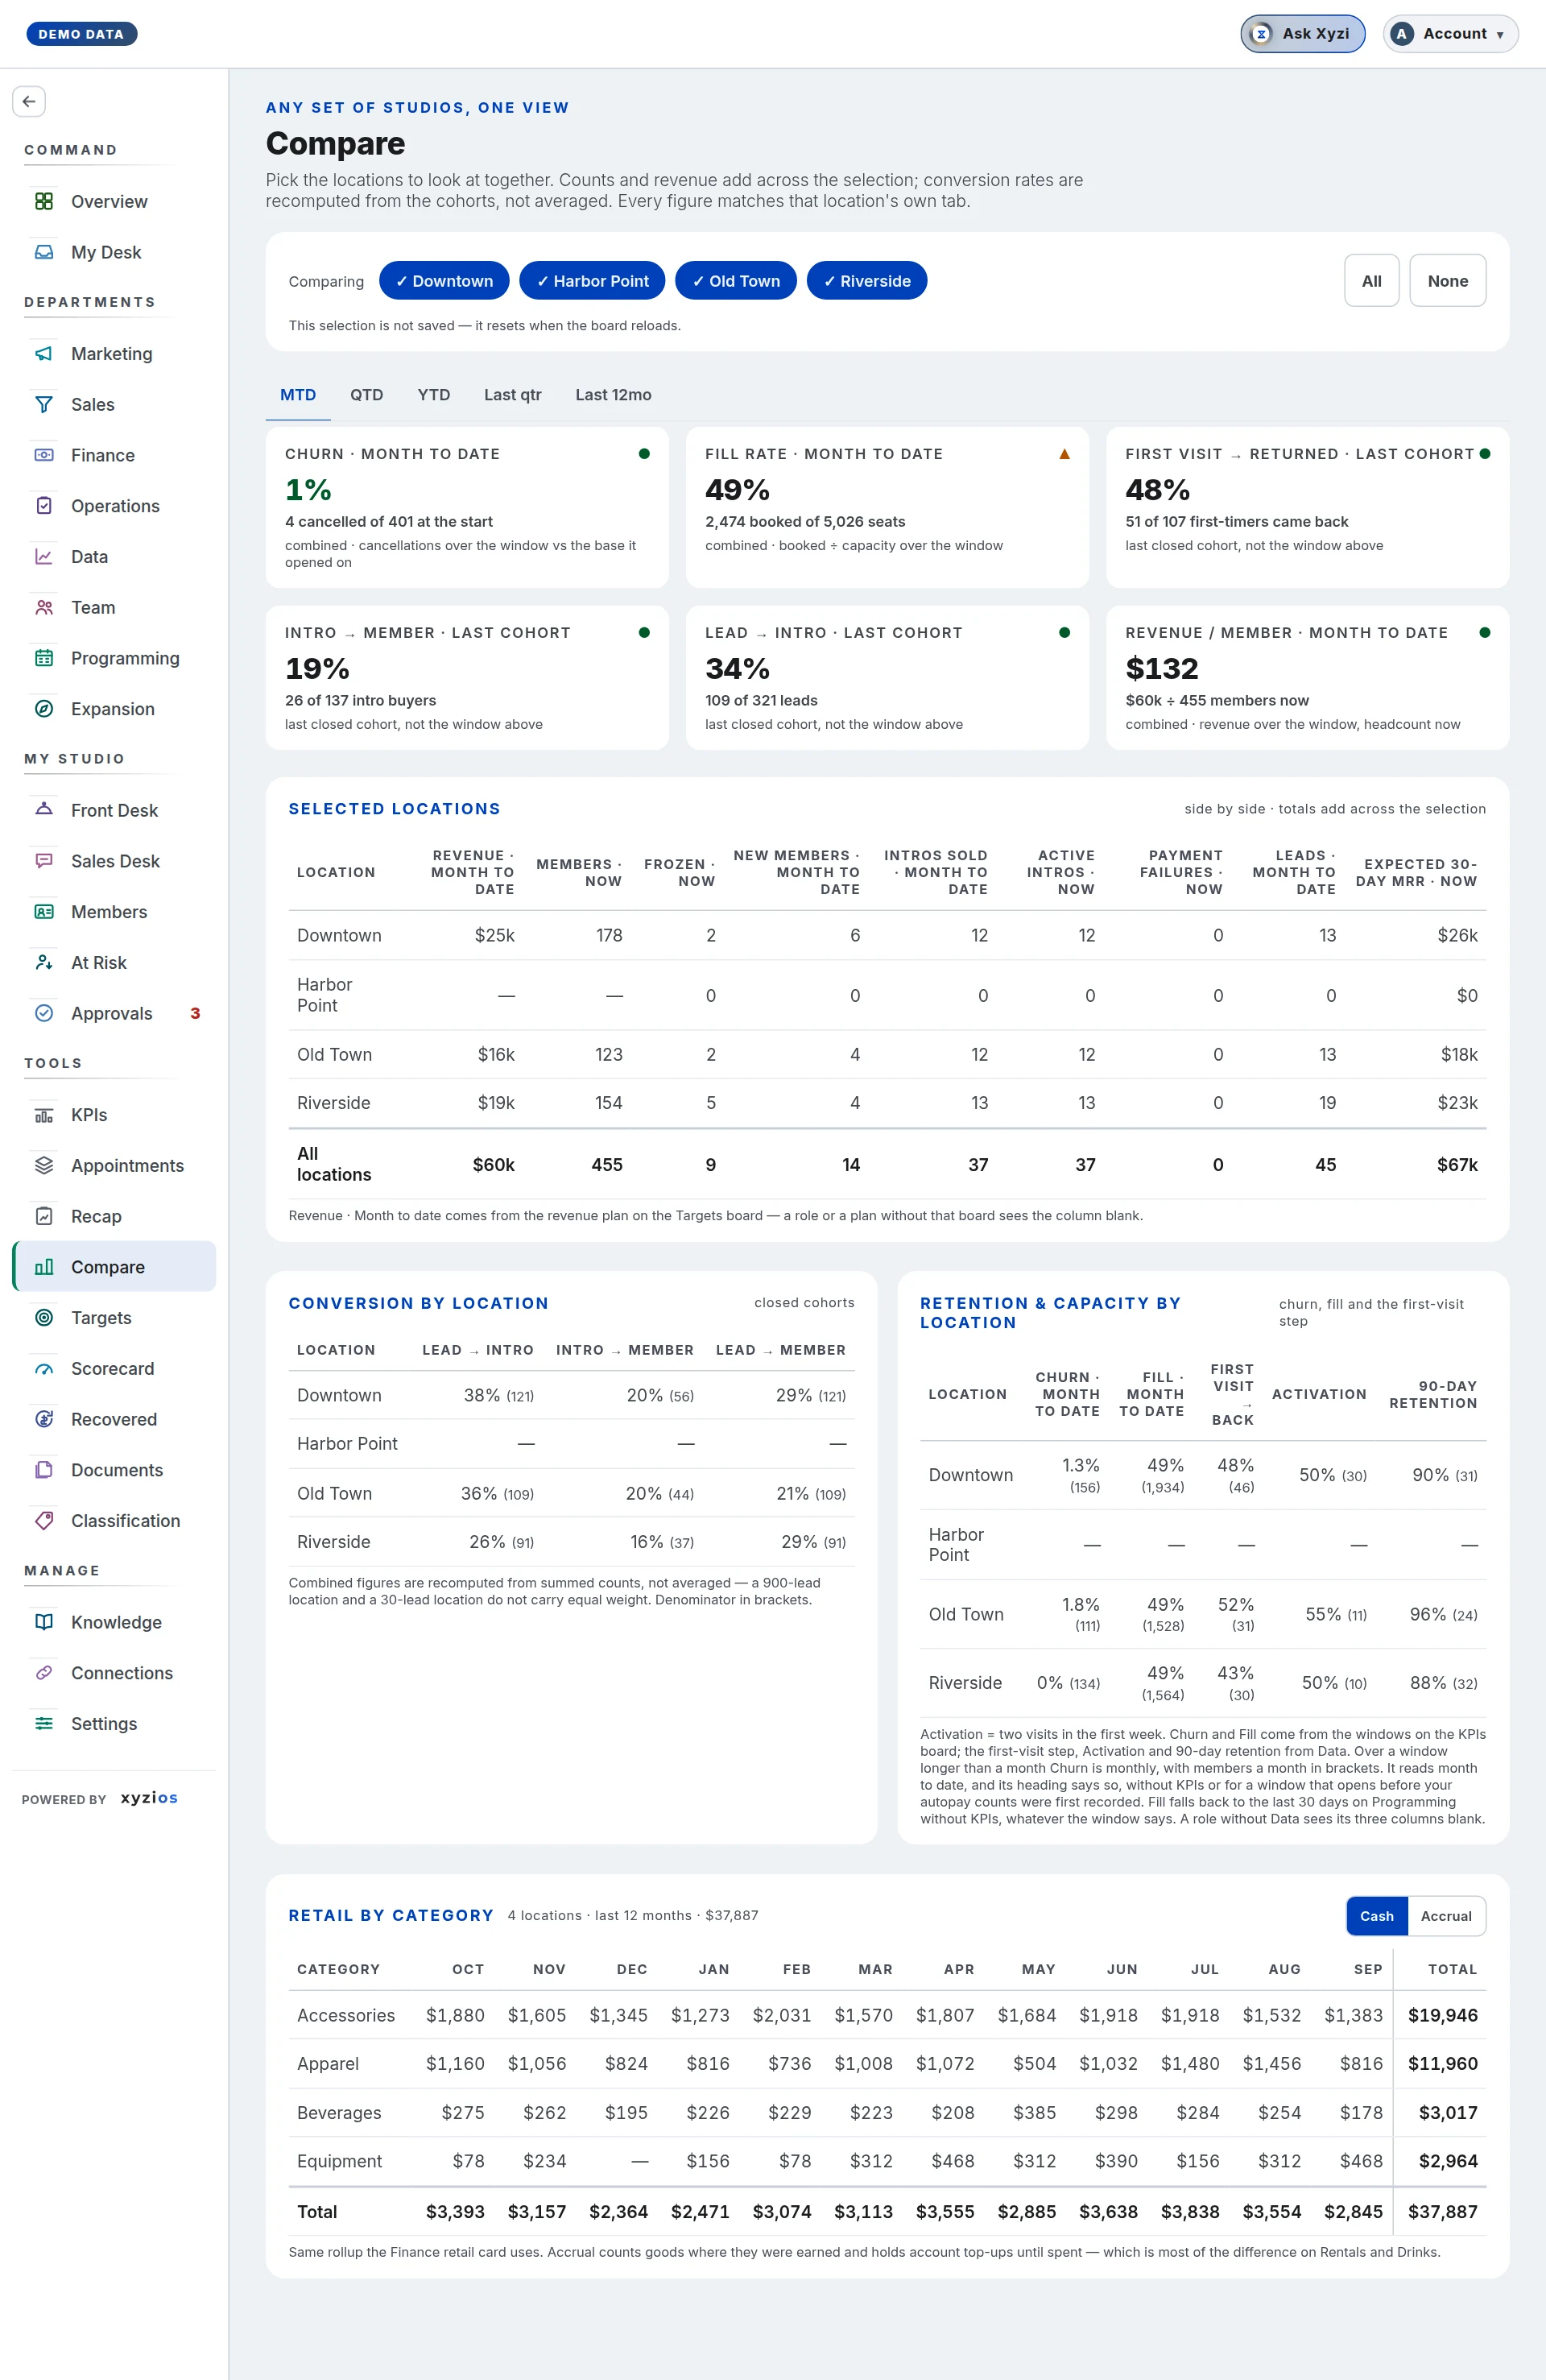
Which of my locations is ahead, which is behind, and by how much? Compare puts any selection of sites on the same footing for one window: counts and revenue add across the selection, conversion rates are recomputed from the underlying cohorts, and every figure matches that location’s own tab elsewhere in Xyzios. It appears in the rail only when the studio has more than one location.
How to read it
1Comparing at the top is the picker: one pill per location, ticked when included, plus All and None. The selection is not saved and resets when the board reloads. With nothing picked the board asks you to pick at least one.
The tabs beneath set the window for everything marked with it: MTD, QTD, YTD and whichever closed windows the studio can fill.
Six cards come first, each named with its window:
- 2Churn: cancellations against the autopay members each location had when the window opened, which is the count recorded at the close of the month before it, combined across the selection. Low is good. Over a window longer than a month it reads Monthly churn: each month’s cancellations against the members that month opened with, so a quarter or a year sits on the same scale as a month. When a count it needs was never recorded, the card shows month to date instead and says why.
- 3Fill rate: spots booked of spots offered.
- 4First visit → returned, Intro → member and Lead → intro, each · last cohort: these three ignore the window on purpose. They need a cohort old enough to have an answer, so they read the last closed one.
- 5Revenue / member: revenue over the window divided by members now. A site whose Revenue column is blank adds nothing to it.
If your booking platform’s orders start partway through the window, the Revenue column and this card name the day they start (Revenue · from that date) instead of the window, the same words the Sales board uses.
6Selected locations is the side-by-side table. Columns tagged with the window move with the tabs (Revenue, New members, Intros sold, Leads). Columns tagged · now are balances as of today and never move (Members, Frozen, Active intros, Payment failures, Expected 30-day MRR). A total row adds the selection. When every location is picked and the totals fall short of the company, two more rows appear, No location recorded and Company total, with a note explaining that some members and payments carry no location in the booking platform.
7Conversion by location shows Lead → intro, Intro → member and Lead → member per site from closed cohorts, denominators in brackets. 8Retention & capacity by location shows Churn, Fill, First visit → back, Activation (two visits in the first week) and 90-day retention. Fill and the first-visit step come from Programming and Data, so a role without those boards sees them blank here too.
Retail by category, when your plan includes the retail breakdown, lists retail revenue by category for the last 12 months with a Cash / Accrual toggle.
If you manage some locations, only those appear in the picker.
What to do here
The board is read-only.
- Tick the locations you want together, or press All.
- Pick the window.
- Find the outlier in the per-location tables. The cards give the combined figure; the tables show who is dragging it.
- To act on what you find, go where the number lives: KPIs for pace and daily rate, Sales and Data for cohorts and churn, Programming for fill.
Common questions
Why do my locations not add up to the company total?
Some profiles have no home studio, and an online store belongs to no room. They count for the company and for no site, which is what the No location recorded row shows. A studio where everything is attributed never sees that row.
Why did half the table not move when I changed the window?
Columns marked · now are balances. How many members there are today has no “quarter to date” version; only flows carry the window.
Why does Churn say Month to date when I picked another window?
Churn divides by the autopay members you had at the start of each month in the window, and each of those counts is taken at the close of the month before. If the window reaches back before your first recorded count, there is nothing to divide by, so the card and the Churn column in Retention & capacity by location both show month to date and the card names the months it needs. They fill in as your history builds.
Why is churn over a quarter or a year monthly?
Cancellations over a long window against the members at its start count everyone who joined during the window and left again, so the figure grows with the window: a year could read 50% at a healthy studio. Monthly churn divides each month’s cancellations by the members that month opened with, so every tab reads on the same scale and the same grading applies. The brackets in the location table show the average members a month.
Why do the three cohort cards ignore the tabs?
Whether someone came back, converted or bought takes time to answer. Over a week they would all report that almost nobody converted, which is true and useless, so they read the last closed cohort.
A column is blank for every location.
The board borrows that number from another board. If your access does not include Finance, Programming or Data, the matching column stays empty here too.
Is the combined churn an average of the sites?
No. It is recomputed from the summed counts, so a 900-lead location and a 30-lead location are weighted by their size.