
What this board answers
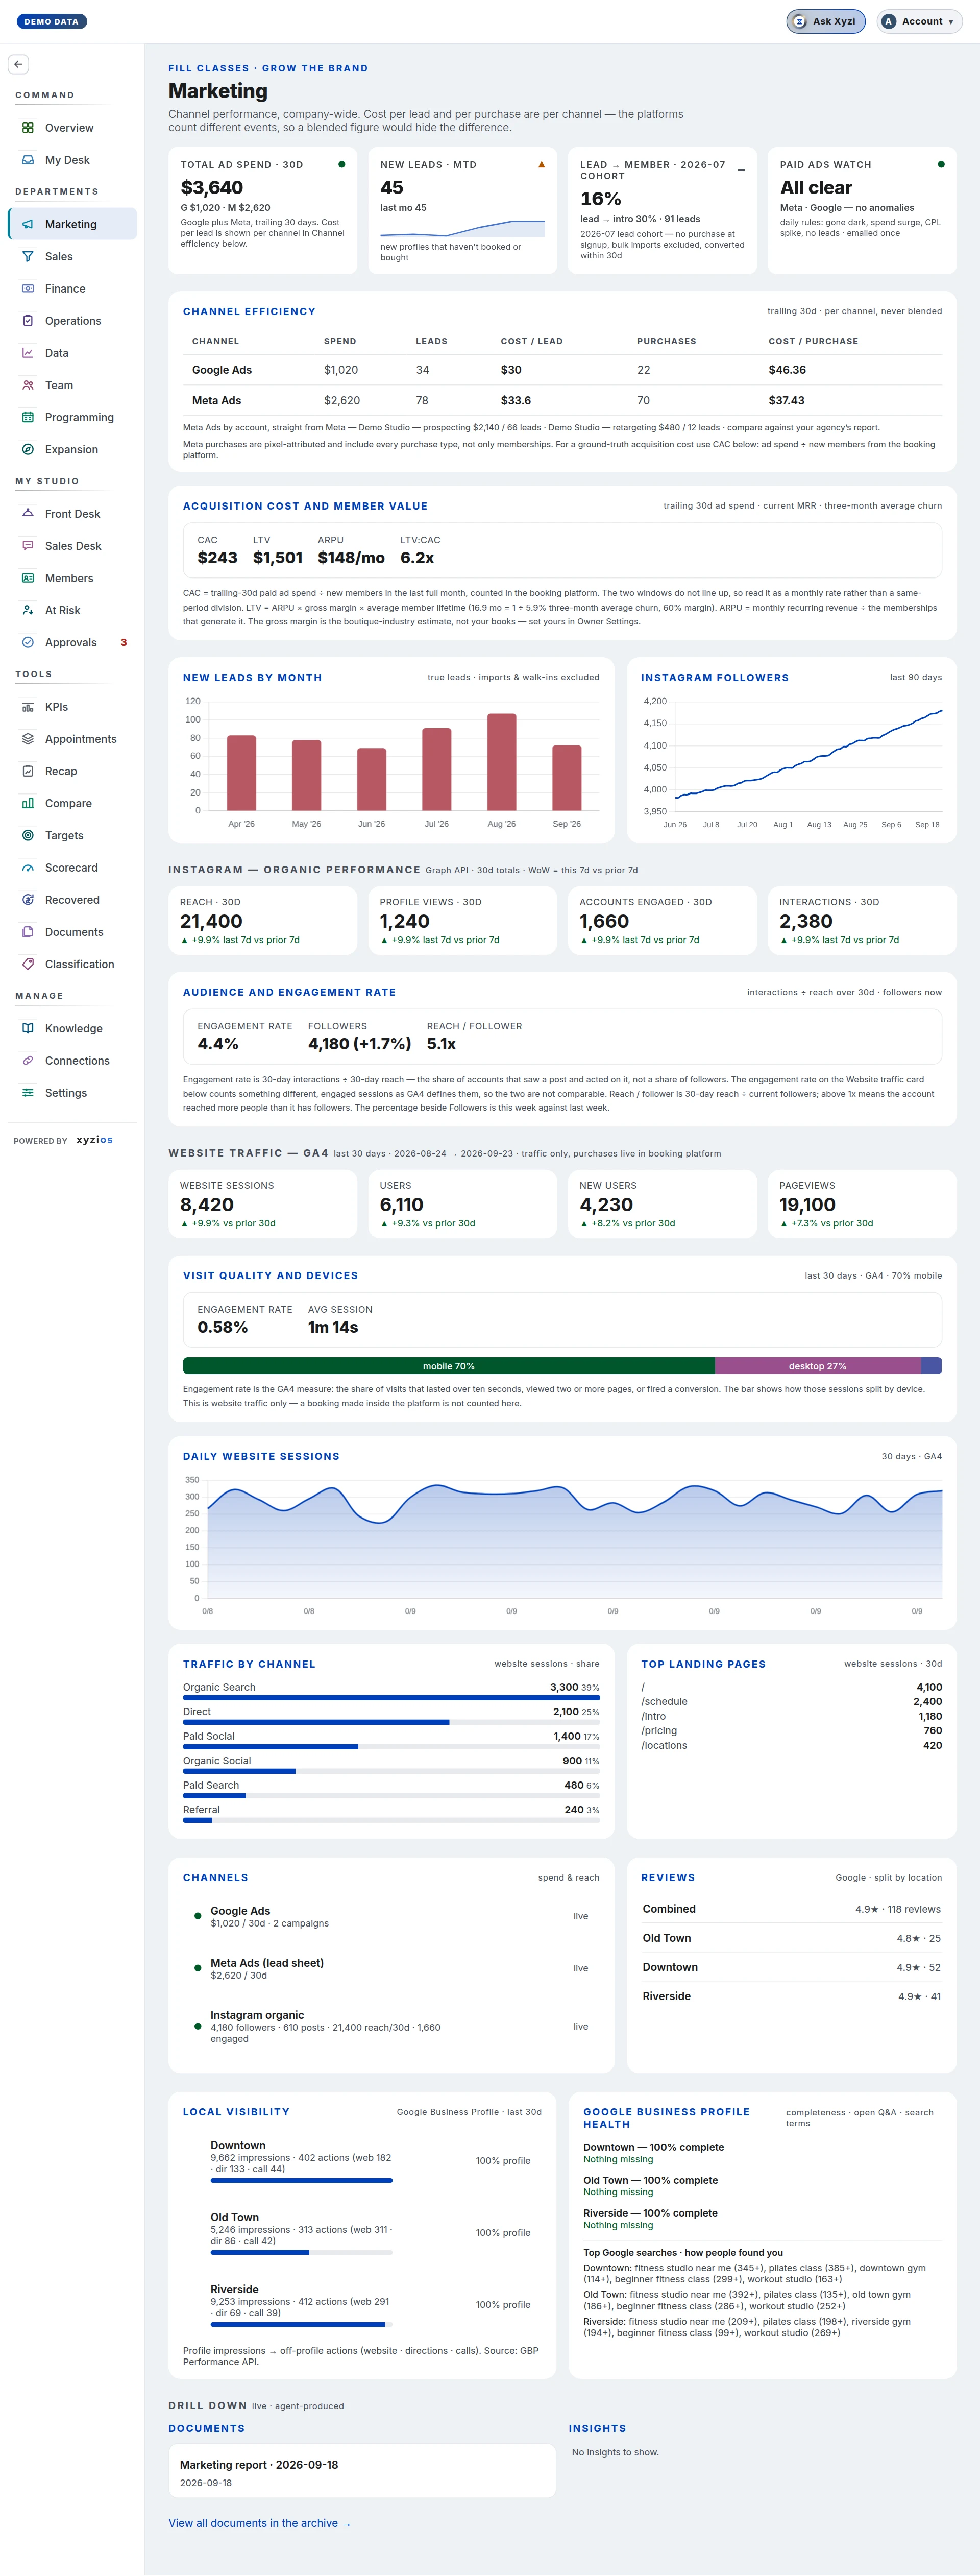
Is the money we spend on marketing bringing people in, and at what price per channel? Does it pay back? Where do new sign-ups fall out before they become members? It is the company view for owners and Directors. A Location Manager never sees this board; ad spend has no location.
How to read it
The mandate says it: channel performance, company-wide, never blended. Google and Meta count different events, so every platform cost is shown per channel.
Four tabs sit under the title: Funnel, Paid ads, Organic & web and Local & reviews. The board always opens on Funnel. Each tab has its own row of cards, and everything under them belongs to that tab. A ⚑ on Paid ads counts campaigns that spent with nothing to show.
A small i beside a panel’s title opens how its numbers are counted.
The period picker. Paid ads and Funnel each carry the same picker, the standard list less Week to date (two days of sign-ups is not a funnel), opening on Month to date: Month, Quarter and Year to date, Previous week, month, quarter and year, and Last 30 days, 90 days, 6 months and 12 months. A window that reaches back before the studio’s first order is not offered. Everything below the picker follows it, except New leads by month. What sits above it keeps its own window and says so in its title.
Paid ads opens on three cards:
- 1Total ad spend · 30d: Google plus Meta, trailing 30 days. The small line splits it G / M.
- 90-day cohort ROAS: the new customers who first bought in four weeks that ended thirteen weeks ago, what they spent in their first 91 days over those weeks’ ad spend, with the payback in months and the ad spend per new customer. Intros are priced low, so a recent window undersells ads that work; this one has had time.
- 2Paid ads watch: one health verdict from daily rules (gone dark, spend surge, cost-per-lead spike, no leads). All clear names the channels being watched. A dash means not enough history to judge yet.
Under them, top to bottom:
- Spend and new members: the last 12 full weeks, each platform’s spend as bars and new members as a line.
- Return on ad spend, new customers, beside Channel mix, is one card in two halves, each a ratio drawn as the two bars it divides. The top is ROAS: what the people who first bought in the period have spent at the studio so far, against the period’s ad spend, with New customers and Cost / new customer under it. Renewals by people who were already customers never count. The bottom, 3Acquisition cost and member value, is LTV:CAC: LTV, what a member is worth today, against CAC, the period’s ad spend over its new members, with ARPU under it.
- Channel mix: the period’s spend by platform and its new customers by the channel their first purchase was tagged with (the hatched part carries no tag), then each tagged channel’s ROAS and cost per new customer once a quarter of them carry a tag. A studio that has not said which products its ads sell sees the spend split alone, and a link to Channel tags on Classification, where it does.
- 4Channel efficiency for the period: Spend, Leads, Cost / lead, Purchases (as the platform says), Tagged sales (as the studio’s own sales say, for a studio whose product names carry a channel suffix) and Cost / purchase, per channel. Cost / new customer joins it once a quarter of the period’s new customers carry a tag. Under it, every campaign in one table, Google’s and then Meta’s, with its status, spend, leads and purchases: the first five of each, and a button for the rest; a ⚑ marks one that spent $100 or more for every 30 days with no lead and no purchase, on a campaign meant to bring them. A flag says when Google records conversions it leaves out of its own Conversions column.
- Channels, last on the tab: what is live, pending or not connected, the ad accounts first. A studio with no ad account connected is told here what to connect.
Funnel opens on three or four cards:
- New leads · MTD: new profiles this month, by your studio’s own definition of a lead (all new profiles, or only those who didn’t buy when their account was set up; it is set in Studio Setup). The previous month sits beneath for scale.
- Lead → intro · MTD and Lead → first class · MTD, one for each way into the studio its funnel has (a studio sold both ways gets both): of this month’s new profiles so far, buyers at sign-up included, the share that bought the intro or took a first class, how many that is and the median days to it. “Usually” is what the studio’s earlier stretches of the same length had reached by the same age, so a month twenty days old is never judged against months that have had time. The other boards read closed months; these are the cards an ad change moves first.
- Lead → member: the share of the last closed lead cohort that became members, with the size of the cohort. A month still open is never used; it would read low only because it is unfinished.
Under them, the picker, and below it the Funnel for the people who signed up in the period: drawn as a funnel: the ads’ impressions and clicks above a dashed line, then New profiles, the studio’s first step and Became a member. The count sits inside each band; beside it, its share of the step before, the median days between and how many did not go on. The widths show the order of the steps, not their size. Biggest drop names the step furthest below the studio’s own earlier periods of the same length, measured at the same age, so recent sign-ups are never judged against ones that have had months. New leads by month sits under it and keeps its 13 months whatever the picker says: a line that stops at the last closed month, the current month a hollow dot marked so far. Free events funnel counts the people whose first free event fell in the period. The Funnel tab is the one a location cuts: pick one in the top bar and New leads by month, the Funnel and Free events funnel count the people whose home location it is, as the Sales Desk counts them. The ads have no location, so a location’s funnel starts at its new profiles. The tab’s two cards and the other tabs stay company-wide, and a line under the cards says so.
Organic & web opens on Instagram followers, Instagram reach · 30d, Website sessions · 30d and Website users · 30d, each with its change. Under them: Audience and engagement rate for Instagram over the last 30 days and Instagram followers over 91 days; then the website: Visit quality and devices, where engagement rate is GA4’s own measure (the share of visits that lasted over ten seconds, viewed two or more pages or fired a conversion) and a booking made inside the booking platform is never a website visit; Daily website sessions; Traffic by channel; Top landing pages; Competitor ad watch when Scout has run.
A studio with the Instagram KPIs switch on has one more tab, Instagram KPIs: its Instagram month by month, against the views goal.
Local & reviews opens on Google rating with its review count, Profile impressions and Profile actions (website clicks, directions and calls), summed across the studio’s Google Business Profiles. Under them: Reviews (a rating tile for each location), Local visibility per location with what people did on each listing, and Google Business Profile health (a completeness ring, each profile field ticked or missing, open Q&A, top Google searches, which are also what your weekly Google posts are written around).
A section stays off the page until its source is connected: absent means no data, not zero. A period whose ad totals have not been read yet says so and leaves its ROAS and CAC blank rather than dividing by part of the spend.
What to do here
- Connect a source on Connections: Google Ads, Meta, Instagram, Google Business Profile, GA4. The board fills in on the next refresh.
- Read Channel efficiency before any agency report. Compare Cost / lead across channels, then Cost / purchase, then open the campaigns and look for a ⚑.
- Judge spend on the 90-day cohort ROAS and its payback, not on the last few weeks alone.
- Check Paid ads watch daily. An alert names the channel and the rule that fired; the owner is emailed once per alert.
- On Funnel, start with Biggest drop: it is the step to work on.
- Fix what Google Business Profile health lists as missing, and answer the open Q&A in your Google listing.
- On Free events funnel, the people who never bought are the Event leads call sheet on Call Lists; work them there.
- ✦ Ask Xyzi in the top bar answers a specific number.
Common questions
Cost per lead is lower here than in my Google Ads account.
Google’s Conversions column drops secondary actions, including the leads your booking platform uploads. The table counts them and flags the gap. Google’s own bidding cannot see them either; ask whoever runs the account to promote them.
Meta shows more purchases than I got new members.
Meta’s purchases are pixel-attributed and include every purchase type, not only memberships. For a true acquisition cost use CAC, which counts new members in the booking platform.
What is a new customer?
Someone whose first paid order falls in the period. Partner customers (ClassPass, Wellhub) and imported lists are left out, and a profile older than the order history the platform keeps is never counted as new, so an annual renewal cannot pass for a new customer.
Why is the return on ad spend low for this month?
The people who first bought this month have had days to spend; an intro now often becomes a membership later. Read the 90-day cohort ROAS card for a window that has had time.
Why is there no split by channel?
It rests on the products whose names carry a channel tag (“- G”, “- M”). Until a quarter of the period’s new customers bought one, the split would be read off too few people, so the board says how many carry a tag instead.
Why is LTV:CAC blank?
A channel’s spend for the period is not in yet, so CAC would be a partial number, or no ad account is connected at all. The board leaves the ratio empty rather than showing a flattering one.
Why is the Instagram or website section missing?
That source is not connected, or it is connected and has reported nothing yet. Channels, at the foot of Paid ads, says which.
What counts as a lead?
Your studio decides, in Studio Setup: all new profiles, or only profiles who didn’t buy when their account was set up. Partner customers, gift-card givers and bulk imports are left out either way, which is why it can read lower than a raw profile count. The Funnel starts from every new profile instead, walk-ins included until sources are tracked, because most people an ad sends sign up and buy in one go.
Who can see this board?
Owners and Directors. Front desk, instructors and Location Managers do not get it.